Naviter SeeYou
One Year Subscription
PLEASE USE BUTTON BELOW TO PURCHASE


Naviter SeeYou Subscription - One Year
SeeYou – makes You a better pilot!
General Description
Naviter SeeYou Subscription - One Year - has been designed to simplify the process of learning the skills an exceptional pilot needs. If you can imagine it or want it, chances are we have developed it!
SeeYou Subscription is a bundle of three software packages. SeeYou for PC, SeeYou Cloud, and SeeYou Navigator. With this bundle, you can plan, navigate, and learn from your flights on PCs, tablets, and smartphones running Mac, Windows, iOS, Android, or Linux operating systems.
CLICK BUTTON BELOW TO ORDER YOUR SEEYOU ONE YEAR SUBSCRIPTION AND USE THE COUPON CODE wingsandwheels to receive 20% off your first purchase. PLEASE NOTE: discount only applies to your first purchase. No further discounts are offered on future renewals.
USE COUPON CODE: wingsandwheels

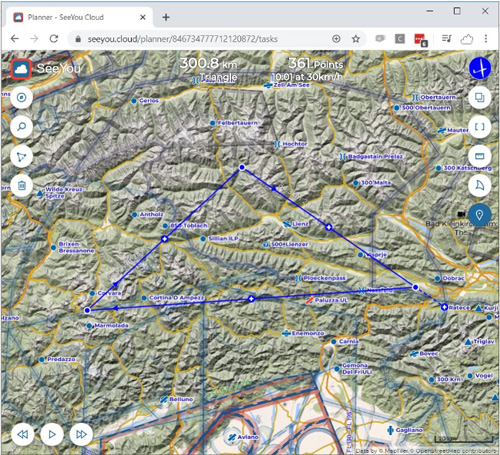
PLAN
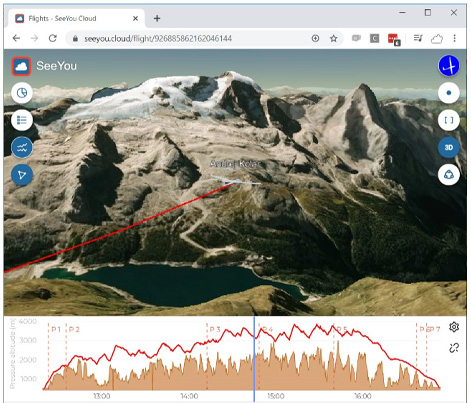
Prepare for your next flight with SeeYou, featuring high-resolution maps and an easy-to-use planning tool. Create task collections that match your ambitions for the near future. Integration with TopMeteo and SkySight weather forecasts makes it easy to get the most out of every flight. Sync your navigation device with SeeYou and you are ready for your next adventure.
Plan your next flight online with SeeYou.Cloud or download SeeYou for Windows for offline use:
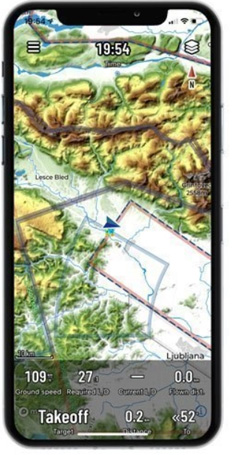
Navigate
NEW! SeeYou Navigator for iOS and Android is now part of the SeeYou Subscription!
Navigate home, avoid airspace, share the sky with your friends, follow the best energy lines, and avoid bad weather. All this and more with SeeYou Navigator. A simple and intuitive app for your phone.
If you already have an Oudie, LX 9000 or other compatible device, connect it to SeeYou to seamlessly sync waypoints, tasks and flights between your device and SeeYou.
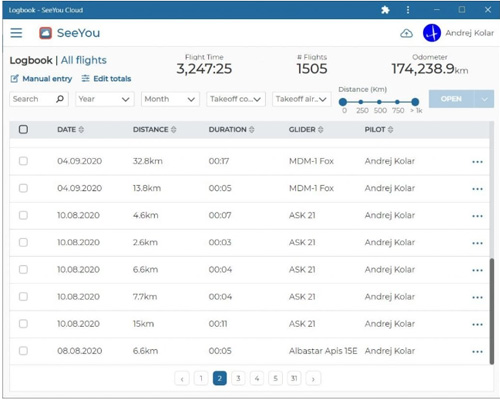
Keep Logbook
NEW! Your pilot logbook is nicely organized in SeeYou.
SeeYou Logbook writes itself. Just upload your flights and they will be automatically added to your logbook if they are recognized as yours.
Sort and filter your flights to get the report you are looking for.
Bring your logbook to life by adding pictures and videos of your flight.
Do not have a GPS track for your flight? No problem. Add the flight manually and it will appear in your logbook just the same.
Learn & Share
After landing, you can immediately share your new experience with friends and learn from it.
Impress your friends with stunning 3D replays. Learn from the impressive flight statistics. Find out how to improve next time by comparing your route with others. Or track your progress via the logbook.